NR No. 24-02
Contact: Loree Levy/Aubrey Henry
916-654-9029
mediainquiries@edd.ca.gov
Important Note: The employment data for the month of December 2023 is taken from the survey week including December 12. Data for January 2024 is scheduled for release on March 8, 2024 due to the annual benchmarking process on labor data.
Employers added 23,400 nonfarm payroll jobs
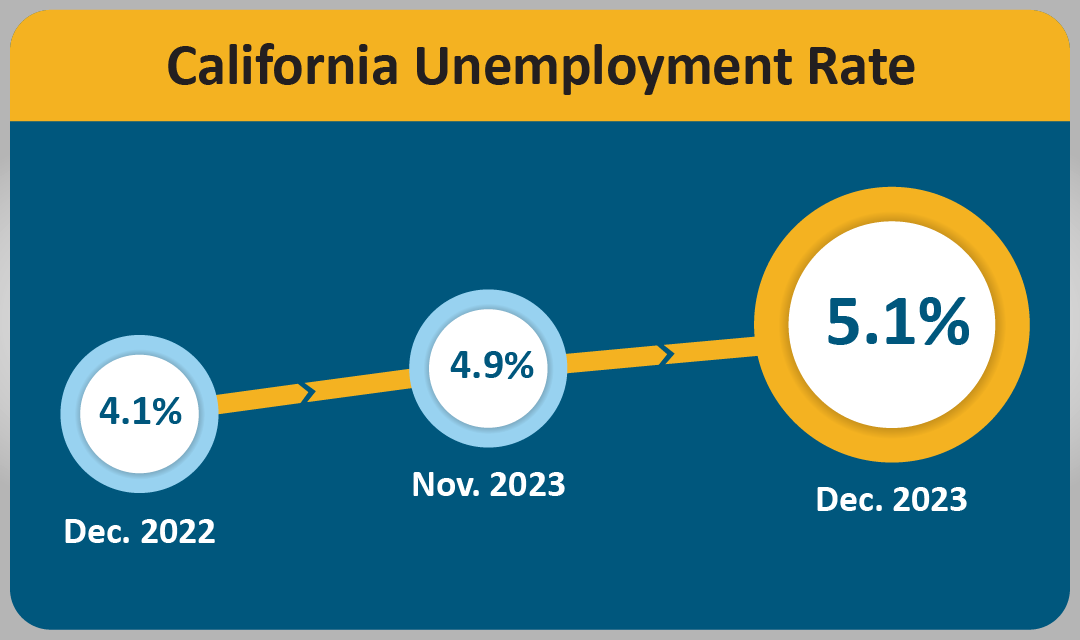
SACRAMENTO – California’s unemployment rate increased to 5.1 percent1 in December 2023 despite the state’s employers adding 23,400 nonfarm payroll jobs2 to the economy, according to data released today by the Employment Development Department (EDD) from two surveys.
California's Labor Market, by the Numbers...
- California’s December job gain accounted for 10.8 percent of the 216,000 overall job gain for the nation.
- California’s 23,400 December nonfarm job gain contributes to 12 consecutive months of job gains in 2023 after recording its last net job loss in December of 2022.
- Six of California's 11 industry sectors gained jobs in December with Private Education & Health Services (+13,200) leading in gains thanks to above-average increases in Nursing Care Facilities and Individual & Family Services.
- Government (+8,100) experienced job increases in both City Government and Special Districts with local government jobs within the state now showing seven consecutive months of increases.
- Leisure & Hospitality (+7,100) saw job gains in the Accommodation industry group, and the Limited-Service Restaurants and Other Eating Places industry groups.
- Month-over losses in Professional & Business Services (-3,800) were largely due to reductions in Employment Services.
1. The unemployment rate comes from a separate federal survey of 5,100 California households.
2. The nonfarm payroll job numbers come from a federal survey of 80,000 California businesses.
Data Trends about Jobs in the Economy
Total Nonfarm Payroll Jobs
Total Nonfarm Payroll Jobs (Comes from a monthly survey of approximately 80,000 California businesses that estimates jobs in the economy – seasonally adjusted)
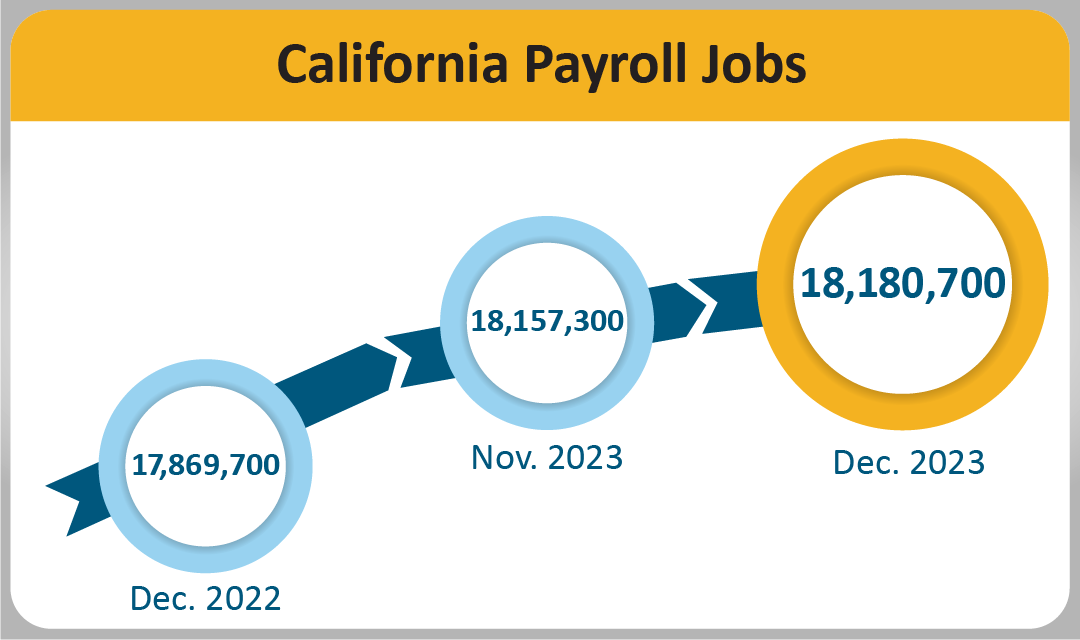
- Month-over – Total nonfarm jobs in California’s 11 major industries totaled 18,180,700 in December – a net gain of 23,400 from November. This followed a downward revised (-1,200) month-over gain of 8,100 jobs in November.
- Year-over – Total nonfarm jobs increased by 311,000 (a 1.7 percent increase) from December 2022 to December 2023 compared to the U.S. annual gain of 2,697,000 jobs (a 1.7 percent increase).
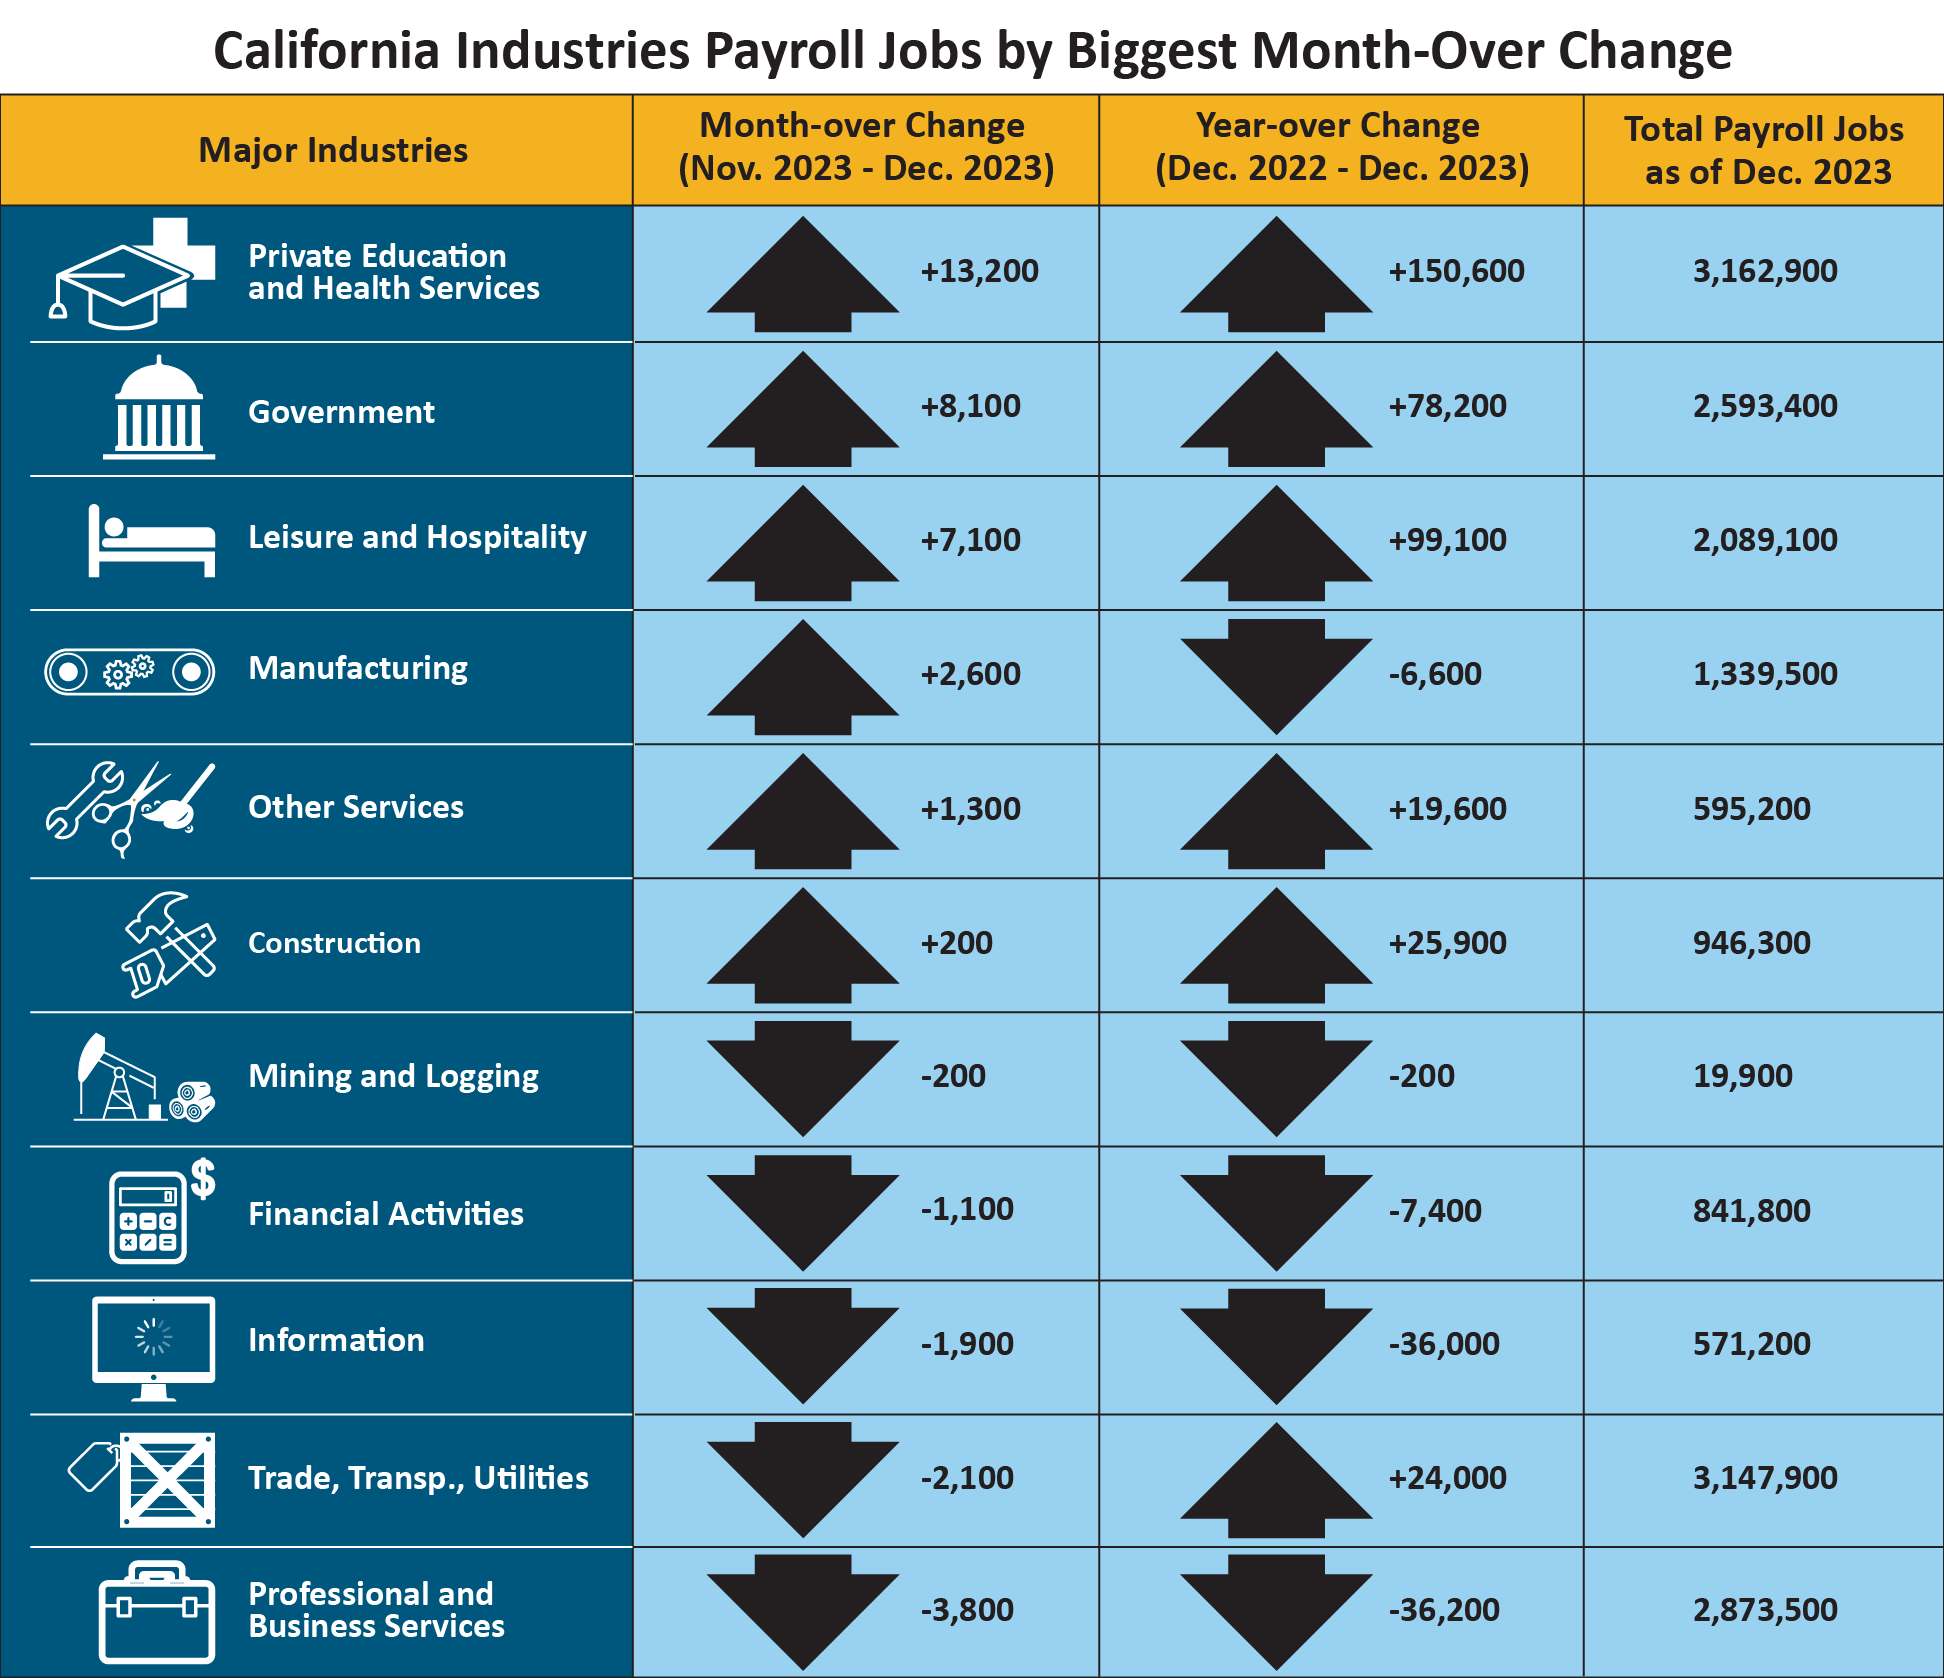
| Major Industries | Month-over Change (Novemer 2023–December 2023) | Year-over Change (December 2022–December 2023) | Total Payroll Jobs as of December 2023 |
|---|---|---|---|
|
Priavate Education and Health Services |
+13,200 | +150,600 | 3,162,900 |
|
Government |
+8,100 | +78,200 | 2,593,400 |
|
Leisure and Hospitality |
+7,100 | +99,100 | 2,089,100 |
| Manufacturing | +2,600 | -6,600 | 1,339,500 |
|
Other Services |
+1,300 | +19,600 | 595,200 |
| Construction | +200 | +25,900 | 946,300 |
|
Mining and Logging |
-200 | -200 | 19,900 |
|
Financial Activities |
-1,100 | -7,400 | 841,800 |
|
Information |
-1,900 | -36,000 | 571,200 |
|
Trade, Transp., Utilities |
-2,100 | +24,000 | 3,147,900 |
|
Professional and Business Services |
-3,800 | -36,200 | 2,873,500 |
Total Farm jobs – The number of jobs in the agriculture industry increased from November by 3,000 to a total of 445,900 jobs in December. The agriculture industry had 9,100 more farm jobs in December 2023 than it did in December a year ago.
Data Trends about Workers in the Economy
Employment and Unemployment in California (Based on a monthly federal survey of 5,100 California households which focuses on workers in the economy)
- Employed – The number of Californians employed in December was 18,373,900, a decrease of 32,700 persons from November’s total of 18,406,600 and down 108,200 from the employment total in December 2022.
- Unemployed – The number of unemployed Californians was 983,000 in December, an increase of 29,200 over the month and up 192,700 in comparison to December 2022.
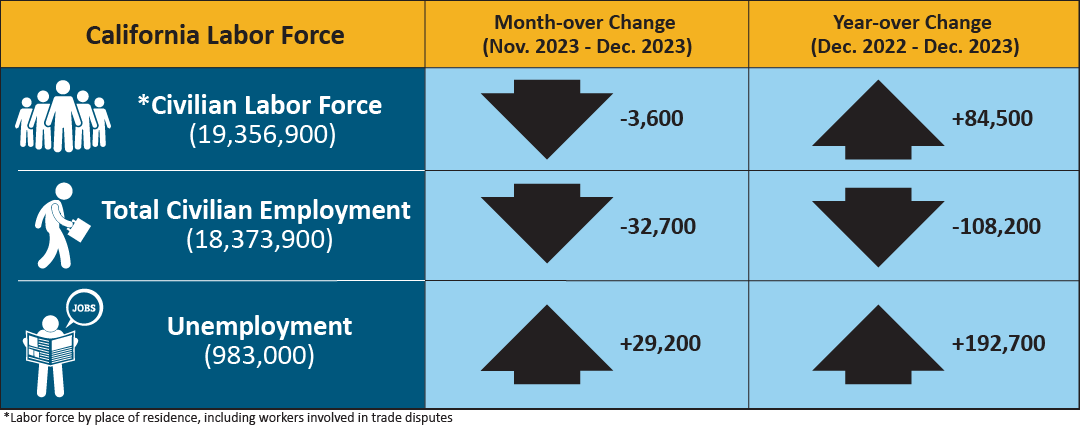
| California Labor Force | Month-over Change (November 2023–December 2023) | Year-over Change (December 2022–December 2023) |
|---|---|---|
| * Civilian Labor Force (19,356,900) | -3,600 | +84,500 |
| Total Civilian Employment (18,373,900) | -32,700 | -108,200 |
| Unemployment (983,000) | +29,200 | +192,700 |
* Labor force by place of residence, including workers involved in trade disputes.
Unemployment Insurance Claims (Not Seasonally Adjusted)
The following data is from a sample week that includes the 19th of each month:
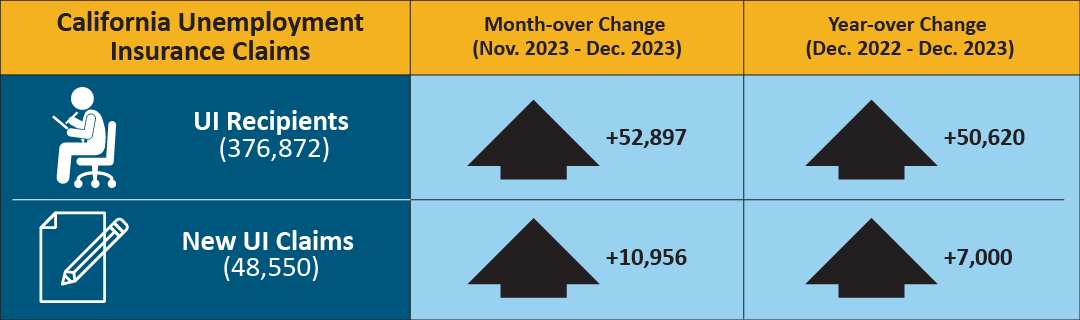
In related data that figures into the state’s unemployment rate, there were 376,872 people certifying for unemployment benefits during the December 2023 sample week. That compares to 323,975 people in November and 326,252 people in December 2022. Concurrently, 48,550 initial claims were processed in the December 2023 sample week, which was a month-over increase of 10,956 claims from November, and a year-over increase of 7,000 claims from December 2022.
| California Unemployment Insurance Claims | Month-over Change (November 2023–December 2023) | Year-over Change (December 2022–December 2023) |
|---|---|---|
| UI Recipients (376,872) | +52,897 | +50,620 |
| New UI Claims (48,550) | +10,956 | +7,000 |
| COUNTY | LABOR FORCE | EMPLOYMENT | UNEMPLOYMENT | RATE |
|---|---|---|---|---|
| STATE TOTAL | 19,208,000 | 18,235,700 | 972,300 | 5.1% |
| ALAMEDA | 826,600 | 789,500 | 37,100 | 4.5% |
| ALPINE | 580 | 540 | 40 | 6.6% |
| AMADOR | 14,270 | 13,520 | 740 | 5.2% |
| BUTTE | 91,300 | 86,100 | 5,200 | 5.7% |
| CALAVERAS | 22,190 | 21,180 | 1,000 | 4.5% |
| COLUSA | 10,240 | 8,580 | 1,660 | 16.2% |
| CONTRA COSTA | 550,700 | 525,800 | 24,900 | 4.5% |
| DEL NORTE | 9,260 | 8,670 | 600 | 6.4% |
| EL DORADO | 93,900 | 89,700 | 4,100 | 4.4% |
| FRESNO | 459,700 | 422,200 | 37,600 | 8.2% |
| GLENN | 12,270 | 11,440 | 820 | 6.7% |
| HUMBOLDT | 60,400 | 57,400 | 3,000 | 5.0% |
| IMPERIAL | 74,000 | 60,400 | 13,500 | 18.3% |
| INYO | 8,310 | 7,970 | 350 | 4.2% |
| KERN | 393,300 | 358,900 | 34,400 | 8.7% |
| KINGS | 58,000 | 52,800 | 5,300 | 9.1% |
| LAKE | 27,840 | 25,920 | 1,920 | 6.9% |
| LASSEN | 8,610 | 8,140 | 470 | 5.4% |
| LOS ANGELES | 4,894,800 | 4,651,200 | 243,700 | 5.0% |
| MADERA | 65,000 | 59,900 | 5,100 | 7.9% |
| MARIN | 130,700 | 125,800 | 4,800 | 3.7% |
| MARIPOSA | 7,450 | 7,050 | 400 | 5.4% |
| MENDOCINO | 36,550 | 34,590 | 1,970 | 5.4% |
| MERCED | 112,700 | 101,200 | 11,500 | 10.2% |
| MODOC | 3,070 | 2,820 | 240 | 7.9% |
| MONO | 9,360 | 8,950 | 400 | 4.3% |
| MONTEREY | 220,200 | 201,200 | 19,000 | 8.6% |
| NAPA | 69,300 | 66,400 | 2,900 | 4.1% |
| NEVADA | 48,450 | 46,390 | 2,050 | 4.2% |
| ORANGE | 1,599,900 | 1,539,300 | 60,600 | 3.8% |
| PLACER | 195,000 | 187,100 | 7,900 | 4.0% |
| PLUMAS | 6,930 | 6,350 | 590 | 8.5% |
| RIVERSIDE | 1,158,400 | 1,098,700 | 59,700 | 5.2% |
| SACRAMENTO | 731,900 | 697,100 | 34,700 | 4.7% |
| SAN BENITO | 32,500 | 30,400 | 2,200 | 6.6% |
| SAN BERNARDINO | 1,013,600 | 962,900 | 50,700 | 5.0% |
| SAN DIEGO | 1,593,200 | 1,525,000 | 68,200 | 4.3% |
| SAN FRANCISCO | 572,800 | 552,800 | 20,000 | 3.5% |
| SAN JOAQUIN | 344,600 | 321,000 | 23,600 | 6.8% |
| SAN LUIS OBISPO | 137,700 | 132,700 | 5,000 | 3.6% |
| SAN MATEO | 452,900 | 438,100 | 14,700 | 3.2% |
| SANTA BARBARA | 223,300 | 213,200 | 10,000 | 4.5% |
| SANTA CLARA | 1,046,800 | 1,006,200 | 40,600 | 3.9% |
| SANTA CRUZ | 132,100 | 123,300 | 8,700 | 6.6% |
| SHASTA | 71,000 | 67,000 | 4,000 | 5.6% |
| SIERRA | 1,290 | 1,230 | 60 | 4.9% |
| SISKIYOU | 16,420 | 15,210 | 1,200 | 7.3% |
| SOLANO | 201,500 | 191,200 | 10,300 | 5.1% |
| SONOMA | 248,800 | 239,300 | 9,600 | 3.8% |
| STANISLAUS | 244,700 | 227,700 | 16,900 | 6.9% |
| SUTTER | 46,200 | 42,200 | 4,000 | 8.7% |
| TEHAMA | 25,230 | 23,630 | 1,610 | 6.4% |
| TRINITY | 4,300 | 4,030 | 270 | 6.3% |
| TULARE | 209,100 | 185,700 | 23,500 | 11.2% |
| TUOLUMNE | 19,560 | 18,530 | 1,040 | 5.3% |
| VENTURA | 417,400 | 397,600 | 19,800 | 4.7% |
| YOLO | 109,800 | 103,900 | 5,800 | 5.3% |
| YUBA | 32,000 | 29,700 | 2,300 | 7.1% |